Revenue Performance
How is Product Sales performing over time, and which categories are contributing to growth?
An end-to-end MySQL case study using the Olist Brazilian E-Commerce dataset to examine revenue performance, concentration risk, and the relationship between delivery outcomes and customer experience.
The analysis focuses on three management questions, with SQL used as the analytical method rather than the focus of the page.
How is Product Sales performing over time, and which categories are contributing to growth?
Where is Product Sales concentrated across customers, categories, and sellers?
Where do delivery issues occur, and how are delivery outcomes associated with customer reviews?
A consistent scope keeps the analyses comparable and reduces the risk of inflated results from one-to-many joins.
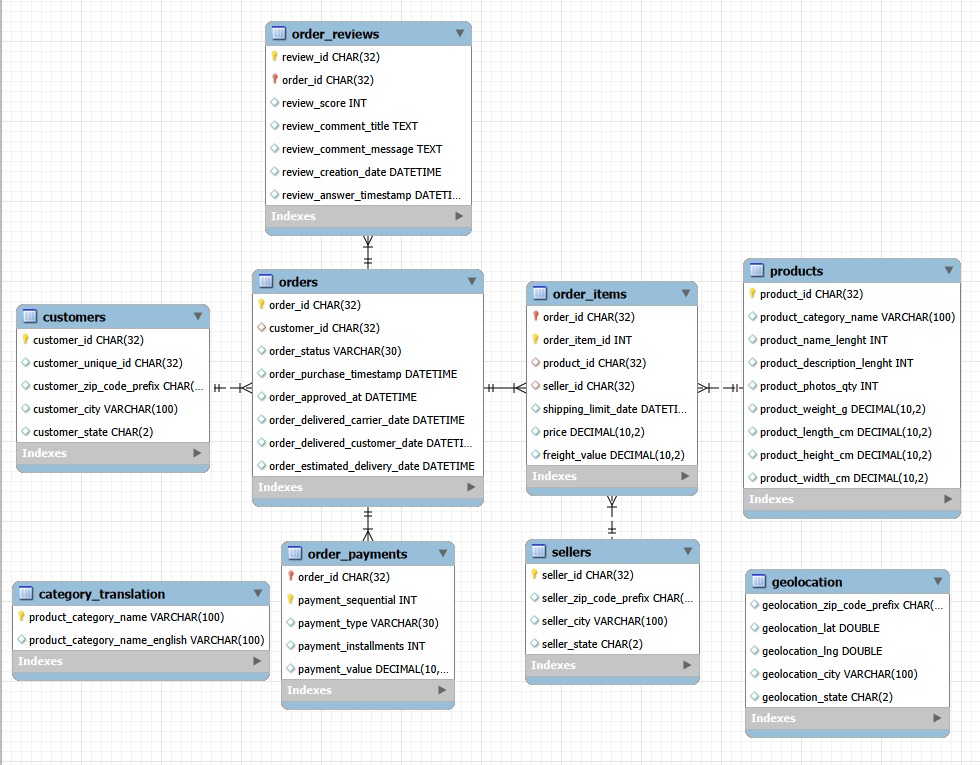
A relational dataset covering orders, customers, products, sellers, payments, reviews, and geographic information.
SUM(order_items.price)
Freight is evaluated separately and is not included in Product Sales.
Incomplete boundary periods are excluded from the main trend analysis.
Sales-related analyses use delivered orders to keep the operating scope consistent.
customer_unique_id for customer-level analysis.orders serves as the central transaction table, linking customers to order items, payments, and reviews. Product and seller dimensions connect through order_items.
Business question: How is the business performing, and what is driving Product Sales growth?
69.44% of category groups grew from 2017 H2 to 2018 H1.
Delivered orders, Jan 2017 to Aug 2018. Product Sales = item price excluding freight.
Growth is not dependent on only a small number of categories, which suggests a relatively broad sales expansion. However, nearly half of positive growth still came from the five strongest growth categories. Management should monitor these key growth drivers while continuing to support growth across the broader category mix.
WITH monthly_sales AS (
    SELECT
        DATE_FORMAT(o.order_purchase_timestamp, '%Y-%m') AS order_month,
        SUM(oi.price) AS product_sales
    FROM orders AS o
    JOIN order_items AS oi
        ON o.order_id = oi.order_id
    WHERE o.order_status = 'delivered'
      AND o.order_purchase_timestamp >= '2017-01-01'
      AND o.order_purchase_timestamp < '2018-09-01'
    GROUP BY order_month
),

sales_with_lag AS (
    SELECT order_month, product_sales,
        LAG(product_sales) OVER (ORDER BY order_month) AS previous_month_sales
    FROM monthly_sales
)

SELECT order_month, product_sales, previous_month_sales,
    ROUND((product_sales - previous_month_sales) / NULLIF(previous_month_sales, 0) * 100, 2) AS mom_growth_pct
FROM sales_with_lag
ORDER BY order_month;Business question: Where is Product Sales concentrated, and where could dependency risk exist?
Delivered orders, Jan 2017 to Aug 2018. Concentration is measured as share of Product Sales.
Product Sales are more concentrated among sellers than among customers or product categories, making seller concentration the strongest potential dependency risk identified in the dataset. Management should monitor exposure to the highest-contributing sellers and evaluate whether key categories have sufficient seller diversification. This analysis identifies concentration, not confirmed supply risk, because the dataset does not include seller capacity, contracts, or substitution options.
WITH seller_sales AS (
    SELECT oi.seller_id AS seller_id, SUM(oi.price) AS product_sales
    FROM orders AS o
    JOIN order_items AS oi
        ON o.order_id = oi.order_id
    WHERE o.order_status = 'delivered'
      AND o.order_purchase_timestamp >= '2017-01-01'
      AND o.order_purchase_timestamp < '2018-09-01'
    GROUP BY oi.seller_id
),
ranked_sellers AS (
    SELECT seller_id, product_sales,
        ROW_NUMBER() OVER (ORDER BY product_sales DESC) AS sales_rank,
        COUNT(*) OVER () AS total_sellers
    FROM seller_sales
)
SELECT ROUND(SUM(CASE WHEN sales_rank <= CEIL(total_sellers * 0.05) THEN product_sales ELSE 0 END) / SUM(product_sales) * 100, 2) AS top_5_pct_share
FROM ranked_sellers;Business question: Where are delivery problems occurring, and how are they associated with customer satisfaction?
Selected states illustrate the variation in late delivery rates across destination markets.
Seller-tier late rates were similar: Tier A 8.47%, Tier B 7.41%, Tier C 8.08%.
Delivered orders, Jan 2017 to Aug 2018. Review analysis uses the latest review per order.
Delivery delays are strongly associated with lower customer satisfaction. The sharp deterioration after approximately three days late provides a practical intervention threshold: orders expected to exceed this point should be prioritized for proactive customer communication or operational review. Geographic differences also suggest that delivery performance should be monitored by destination market, while avoiding assumptions about root cause without additional logistics data.
WITH ranked_reviews AS (
    SELECT r.order_id AS order_id, r.review_score AS review_score,
        ROW_NUMBER() OVER (PARTITION BY r.order_id ORDER BY r.review_answer_timestamp DESC) AS review_rank
    FROM order_reviews AS r
),
latest_reviews AS (
    SELECT order_id, review_score FROM ranked_reviews WHERE review_rank = 1
),
delivery_reviews AS (
    SELECT DATEDIFF(o.order_delivered_customer_date, o.order_estimated_delivery_date) AS delay_days,
        lr.review_score AS review_score
    FROM orders AS o
    JOIN latest_reviews AS lr ON o.order_id = lr.order_id
    WHERE o.order_status = 'delivered'
      AND o.order_purchase_timestamp >= '2017-01-01'
      AND o.order_purchase_timestamp < '2018-09-01'
      AND o.order_delivered_customer_date IS NOT NULL
      AND o.order_estimated_delivery_date IS NOT NULL
)
SELECT CASE WHEN delay_days <= -10 THEN '10+ days early' WHEN delay_days < -3 THEN '3-10 days early'
    WHEN delay_days < 0 THEN '0-3 days early' WHEN delay_days <= 3 THEN 'On time to 3 days late'
    WHEN delay_days <= 7 THEN '3-7 days late' WHEN delay_days <= 15 THEN '7-15 days late'
    ELSE '15+ days late' END AS delivery_timing,
    ROUND(AVG(review_score), 2) AS avg_review_score
FROM delivery_reviews GROUP BY delivery_timing;Seller concentration is the strongest potential dependency risk identified in the analysis, with the top 5% of sellers generating 52.99% of Product Sales. Management should monitor exposure to the highest-contributing sellers and evaluate whether key product categories have sufficient seller diversification.
Growth was relatively broad based, with 50 of 72 category groups increasing sales from 2017 H2 to 2018 H1. However, the top five growth categories still contributed 45.18% of total positive growth. Management should support the strongest growth drivers while continuing to develop the broader category mix.
Customer satisfaction deteriorates sharply once delivery delays exceed approximately three days. Orders expected to cross this threshold should be prioritized for proactive customer communication or operational review, with delivery performance monitored by destination market.
Explore my background and experience, or get in touch.